INT3 isn’t a breakpoint : it’s just a nanomite saying hello
Have you ever heard about nanomites ?
The main concept of Nanomites is about an anti-debug technique where :
- A process forks himself to create a child.
- The parent behaves like a debugger for the child and can modify its memory and registers
- Theses two processes communicate with each other by sending signals (from crashes or breakpoints)
It is considered as an anti-debug technique because on Linux, only one tracer per process at a time is allowed. It is impossible to trace / debug the child.
How does it work ?
Let’s clarify this with a diagram :
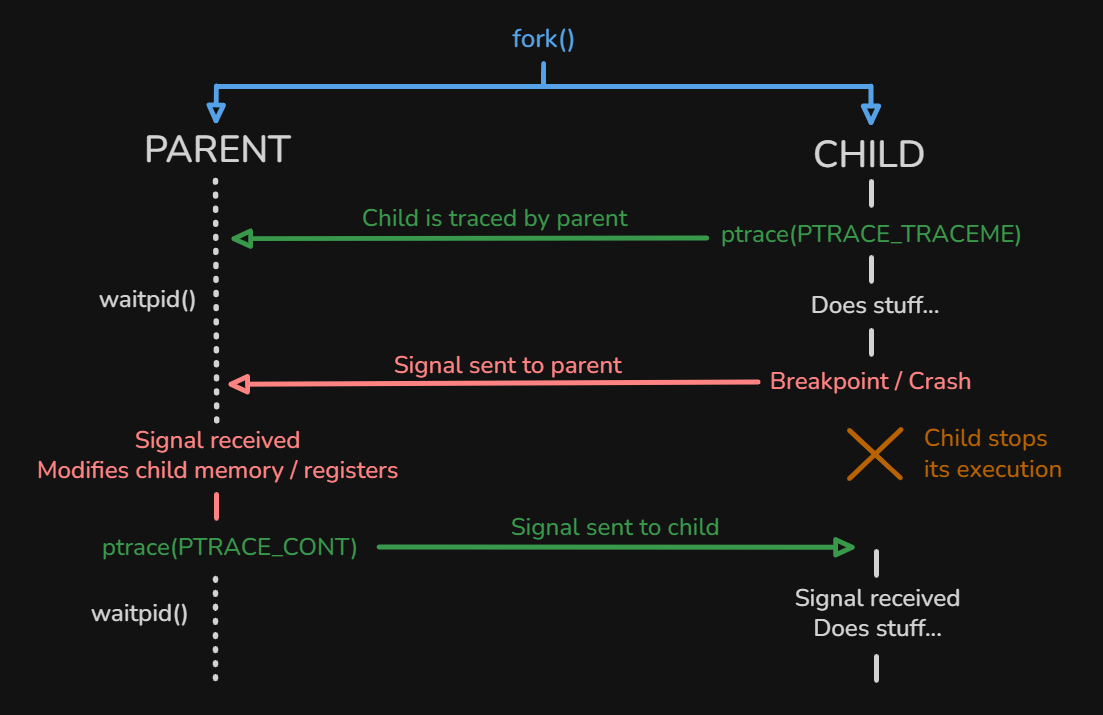
- Step 1 : The parent process forks itself to spawn a child process with
fork()syscall/LIBC function - Step 2 : The child process allows its parent to trace it using
ptrace(PTRACE_TRACEME): no any other process can trace the child since the parent acts like a debugger - Step 3 : The parent process waits to receive any signal from the child using
waitpid() - Step 4 : The child deliberately crashes itself or triggers a breakpoint, sending a signal to the parent
An example of signal sent can be SIGTRAP (from
int3breakpoint instruction), SIGINT (which is often interrupt from keyboardCtrl+C), SIGILL (illegal instruction), SIGSEGV (segmentation fault) and more…
To learn more about POSIX signals, see the signal(7) man page
- Step 5 : The parent receives the signal and modifies the child’s memory and registers using
ptrace(PTRACE_SETREGS). The child is stopped while the parent performs this modification - Step 6 : Once the parent has finished its work, it resumes the child using
ptrace(PTRACE_CONT)and then goes into waiting mode withwaitpid() - Step 7 : Repeat the cycle from Step 4
Example of nanomites
Here is a basic example of using nanomites to decrypt and execute an encrypted command :
11
2#include <stdio.h>
3#include <stdlib.h>
4#include <sys/ptrace.h>
5#include <sys/types.h>
6#include <sys/wait.h>
7#include <sys/user.h>
8#include <unistd.h>
9
10int status;
11struct user_regs_struct regs;
12pid_t pid;
13
14static void child_run(void) // child process will run this function
15{
16 ptrace(PTRACE_TRACEME, 0, 0, 0); // let the parent trace the child
17 char buffer[19] = {91,110,123,108,111,60,40,61,123,108,96,39,106,97,102,39,97,108};
18 register long r8 asm("r8");
19
20 asm("xor rdx,rdx; div rdx"); // trigger SIGFPE because division by 0
21 for(int i=0;i<18;i++){buffer[i]^=r8;} // decrypt buffer using r8 as a key
22 r8=(unsigned long long)buffer;
23 asm("mov rdi,r8; mov rax,[0xdeadbeef];"); // trigger SIGSEGV because 0xdeadbeef address is not mapped
24 asm("int3"); // trigger SIGTRAP because int3 instruction acts as a breakpoint
25 asm("syscall");
26 exit(0);
27}
28
29static void parent_trace(void) // parent process will run this function
30{
31 while (1) {
32 ptrace(PTRACE_CONT, pid, 0, 0); // let the child resume its execution after crash / breakpoint
33 waitpid(pid, &status, 0); // wait for a signal from the child
34 if (WIFEXITED(status)) { // if the child exited, the parent can exit too
35 break;
36 }
37 if (WIFSTOPPED(status)){
38 int signal = WSTOPSIG(status); // get integer value of the signal
39 ptrace(PTRACE_GETREGS, pid, 0, ®s); // get child registers
40 switch(signal)
41 {
42 case SIGTRAP:
43 regs.rax = 59;
44 regs.rsi = 0;
45 regs.rdx = 0;
46 break;
47 case SIGSEGV:
48 regs.rdi += SIGSEGV;
49 regs.rip += 10; // 10 is added to RIP because "mov rax,[0xdeadbeef]" instruction is 10 bytes length
50 break;
51 case SIGFPE:
52 regs.r8 = SIGFPE;
53 regs.rip += 2; // 2 is added to RIP because "div rdx" instruction is 2 bytes length
54 break;
55 }
56 ptrace(PTRACE_SETREGS, pid, 0, ®s); // set child registers
57 }
58 }
59}
60
61void main(void)
62{
63 pid = fork(); // fork parent process to spawn child process
64 (pid == 0) ? child_run() : parent_trace();
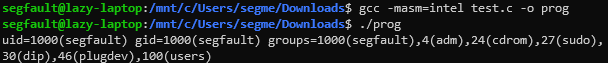
65}After compiling, let’s execute this binary :
Here is the diagram of what’s happening in the code :
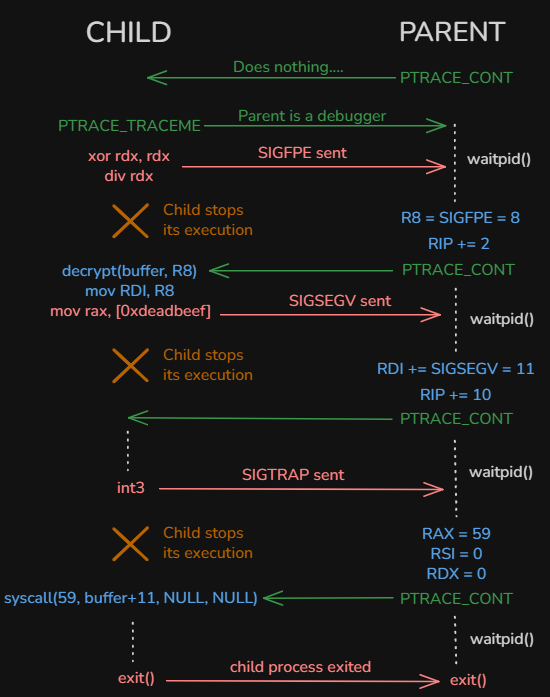
Sounds complicated but it is not :
- The parent process modifies child registers depending on which signal is sent by the child :
SIGTRAP,SIGSEGVandSIGFPE - The child process decrypts the buffer using
R8register as the key (R8 = SIGFPE = 8) - The child process calls
syscall(59, buffer+11, NULL, NULL)which isexecve(buffer+11, NULL, NULL)
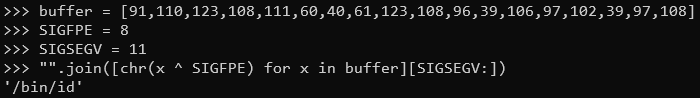
But what is buffer+11 ?
Not debuggable ?
Let’s try to debug this program using strace :
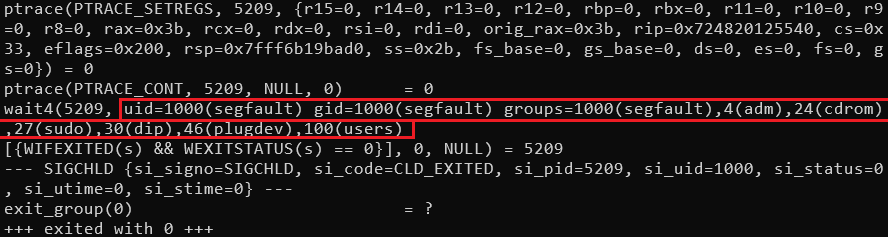
It is still possible to see registers value when using PTRACE_SETREGS from parent process but it doesn’t show execve called from child.
Of course, this example is easy with few lines of code but imagine reversing hundreds of nanomites…
When debugging using gdb :
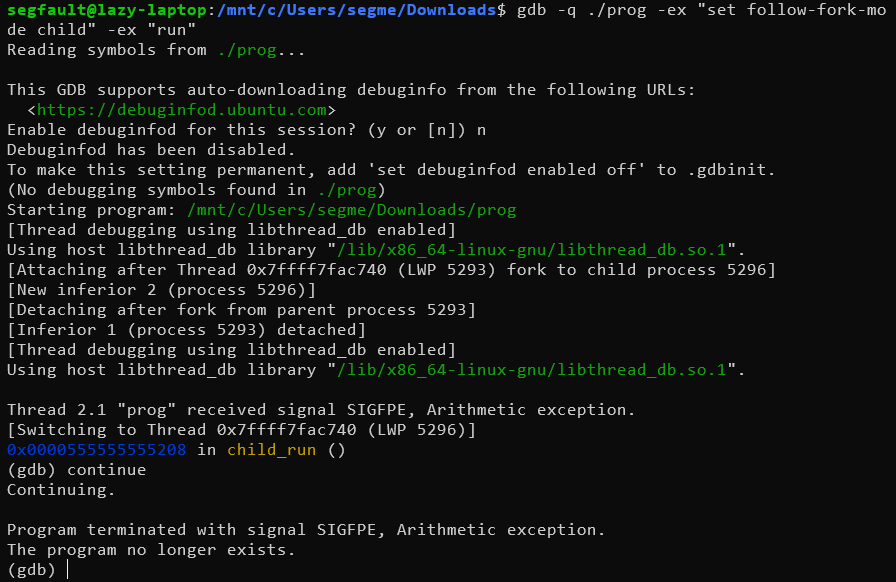
The debugging stops after the first signal because gdb uses ptrace itself, which conflicts with the parent’s ptrace control of the child.
Debugging the child process is hard. But debugging the parent process is still possible.
Dynamic and partial analysis of nanomites (parent perspective)
frida-trace could help us knowing which child process registers were modified between PTRACE_GETREGS and PTRACE_SETREGS using this script (to write inside __handlers__/libc.so.6/ptrace.js):
 11
 2// https://elixir.bootlin.com/linux/v4.7/source/arch/x86/include/asm/user_64.h#L68
 3let all_registers = {"r15":0,"r14":8,"r13":0x10,"r12":0x18,"rbp":0x20,"rbx":0x28,"r11":0x30,"r10":0x38,"r9":0x40,"r8":0x48,"rax":0x50,"rcx":0x58,"rdx":0x60,"rsi":0x68,"rdi":0x70,"orig_rax":0x78,"rip":0x80,"cs":0x88,"eflags":0x90,"rsp":0x98,"ss":0xa0};
 4let saved_getregs = {};
 5let pending_getregs_ptr = null;
 6
 7defineHandler({
 8  onEnter(log, args, state) {
 9    if(args[0] == 12) // PTRACE_GETREGS
10    {
11      pending_getregs_ptr = args[3];
12    }
13    if(args[0] == 13) // PTRACE_SETREGS
14    {
15      for(let reg in all_registers)
16      {
17        let value = args[3].add(all_registers[reg]).readU64().toNumber();
18        let value_to_compare = saved_getregs[reg];
19        if(value !== value_to_compare)
20        {
21          log(`Register ${reg} 0x${value_to_compare.toString(16)} changed to 0x${value.toString(16)}`);
22        }
23      }
24    }
25  },
26
27  onLeave(log, retval, state) {
28    // GETREGS buffer was fully filled by kernel here
29    if(pending_getregs_ptr !== null)
30    {
31      for(let reg in all_registers)
32      {
33        saved_getregs[reg] = pending_getregs_ptr.add(all_registers[reg]).readU64().toNumber();
34      }
35      pending_getregs_ptr = null;
36    }
37  }
38});
And the output :
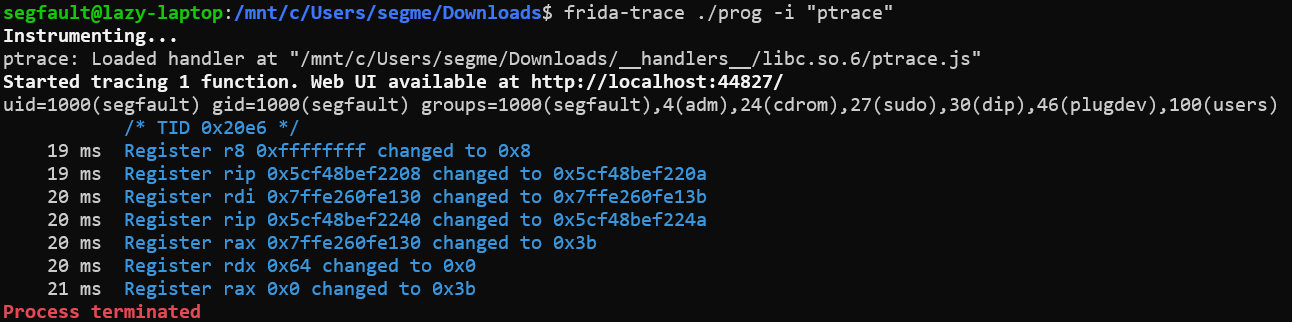
We can easily know that :
- RAX = 0x3b
- RDI = 0x7ffcf9e230cb
- RSI has not changed its value (but we don’t know its value yet)
- RDX = 0x0
RAX = 0x3b and RDI pointing to a userspace buffer sounds like a syscall : execve().
Can we trace child syscalls ?
Yes, using bpftrace tool. But before, let’s outline how strace works :
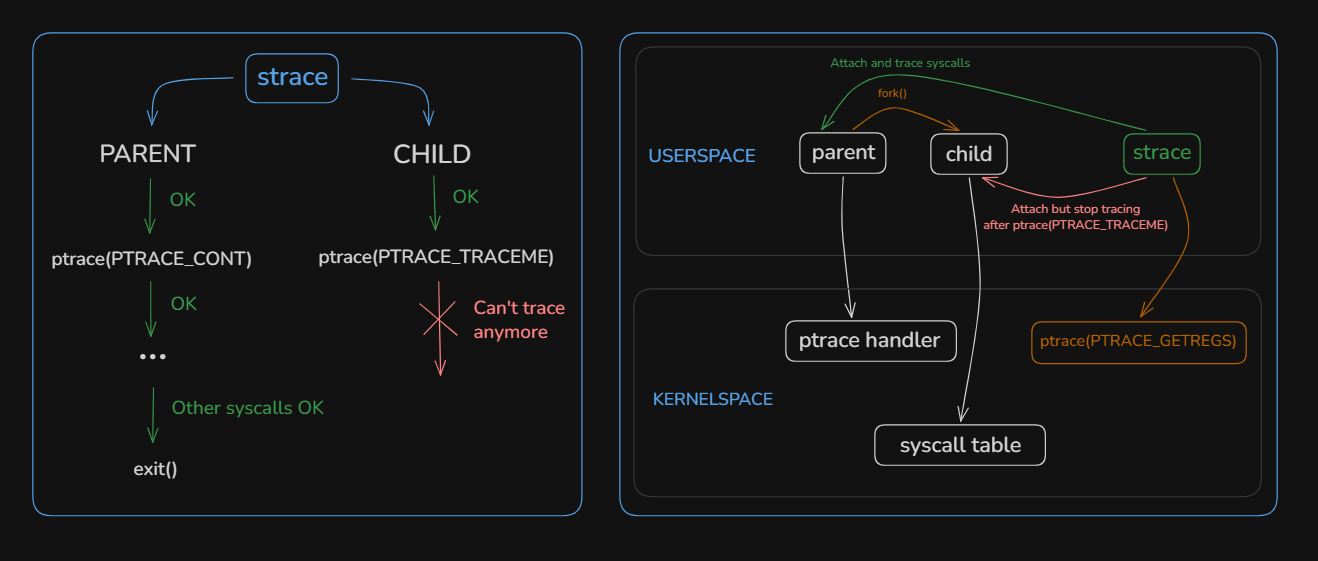
strace attaches to the parent process in userspace and follows the fork().
It is itself a tracer process and uses ptrace() : if the parent is already a tracer of the child (which is the case), then it creates conflicts and the child can’t be traced.
How does bpftrace work ?
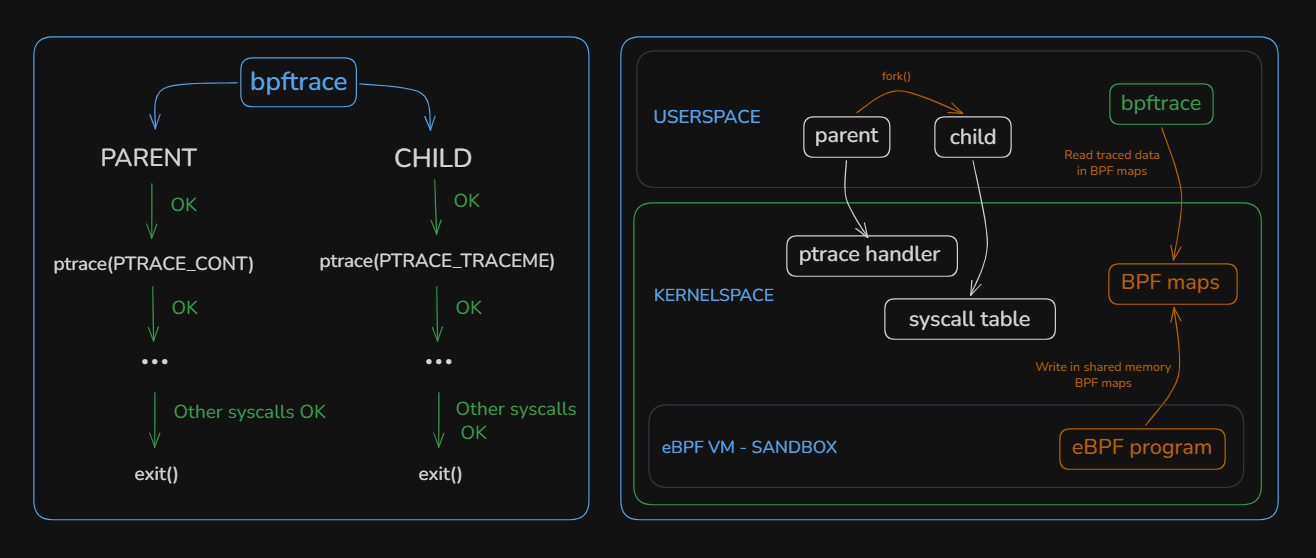
bpftrace doesn’t attach itself to any userland process but it uses a custom eBPF VM inside kernelspace that attach live eBPF probes to multiple kernel objects (kprobes, kretprobes, tracepoints, uprobes, uretprobes, perf events, …)
Because we suspect execve() to be called, let’s trace it using bpftrace so that we can hook all sys_enter_execve() call from kernel and read the filename argument (in RDI register) :
sudo bpftrace -e 'tracepoint:syscalls:sys_enter_execve { printf("%d %s %s\n", pid, comm, str(args->filename)); }'and after executing the binary in an other shell :
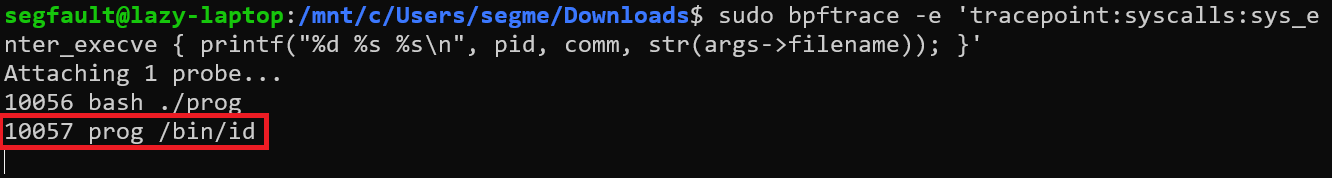
We finally read the string value of RDI register which is "/bin/id".
Note that bpftrace is very useful to trace any kernel call from userspace process (even from nanomites) but it requires to execute it : do not forget to use a secured environment (like a virtual machine) if you’re doing malware analysis…
Pros and Cons of using nanomites
| Pros | Cons |
|---|---|
| Makes debugging, reversing and memory dumping painful | Painful to implement and not portable (in this case with ptrace) |
| Good obfuscation technique where real logic is split between parent and child | Lack of performance due to context switching from ptrace syscall and catched signals |